The window, the ping, and the packetloss of this thing^Wnl-ams02a-rc2
OpenBSD version: 7.1 (and whatever nl-ams02a-rc2 runs on)
Arch:            Any
NSFP:            Well... found this in production... so... probably ok?
So, i had a problem; Had, because since yesterday, i actually know why i had this problem, and much more importantly, how to fix it. See, for quiet some time, i had been having issues with low transfer speeds of my OpenBSD boxes accross a rather long link. While, technically, i should be getting a clean downstream of 1gbit from my DOCSIS link from Ziggo at home, i would be stuck with anything between 10 and 50mbit, sustained, in the downlink. Well, not everywhere. Windows boxes were fine. Linux systems, too. Well, kind of fine. They also did not really excell. But i attributed the 300-400mbit i saw to the shady setup of different tunnels i am running to put my home router into the dfz.
What made this thing even more odd was that it–at first at least–seemed like only SSH/scp/rsync via SSH was affected. Just ripping open a socket and pouring in packets was fine, i would see my 1gbit down. Also, the boxes among each other locally would be fine. Furthermore, it would not matter if this whole thing went down via TCP directly, or via TCP over one of my UDP based tunnels. So, for some time i figured that it was _some_thing in the combination of SSH and the long(er) latency on my path to–back then–Hetzner. Furthermore, this whole situation also did not really improve when i moved from my tunnel based shady-AS setup to a rack over at AS24961.
Hit by a bit of frustration (and awlnx’ suggestion to look at TCP windows), i gave debugging this issue that tracked me over two different DCs another shot.
The Case Description(TM)
So, let’s first look at the case. What we have looks roughly like this (we will expand this graph in this article a bit):
      +-------+               +-------+
Ziggo |AS33915|<--------+-----+AS24961| MyLoc
      +-------+         |     +-------+
                        |
                        |     +-------+
                        +-----+AS59645| Me :-)
                        |     +-------+
                        |
                        |     +-------+
                        +-----+AS29670| IN-Berlin
                        |     +-------+
                        |
                        |     +-------+
                        +-----+AS24940| Hetzner
                              +-------+
I have endpoints at MyLoc, Hetzner, IN-Berlin, and my own AS (which, among others) gets upstream from AS24961.
For yesterday’s debugging session, i also started testing using the OpenBSD base tool tcpbench; This helped me realize that this was not an SSH issue, but much more a TCP issue.
Now, from an endpoint at MyLoc and my own AS, i would see the reduced SSH bandwidth.
A look out of the windows
So, first things first, i started a tcpbench server (tcpbench -s) on my node at AS33915, and another one at one of my machines which is solely routed through MyLoc (and not my own AS; Well, tunnel backbone on another routing table… ;-) )
As expected, transfer speeds were ‘meh’; The same for trying the same thing inside the tunnel.
However, this time around, i ran a tcpdump on both sides.
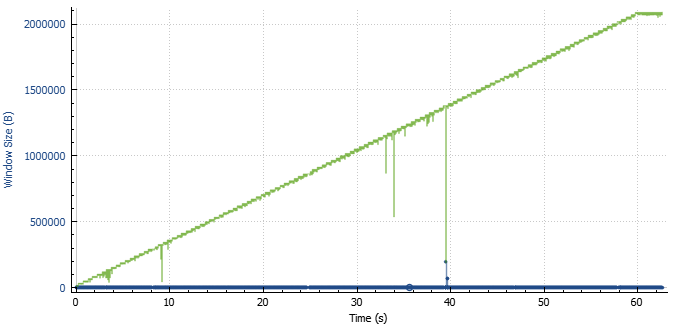
Equipped with the file from my node at home (in AS33915), i fired up wireshark. Using the TCP window size scaling plot (Statistics -> TCP Stream Graphs -> Window Size Scaling), selecting the correct TCP stream, and looking at the correct direction, we end up with the following plot:

We see the window step-wise scaling up… and some weird drops relatively evenly spaced every 2-4 seconds. That… is odd. So, what happens then?
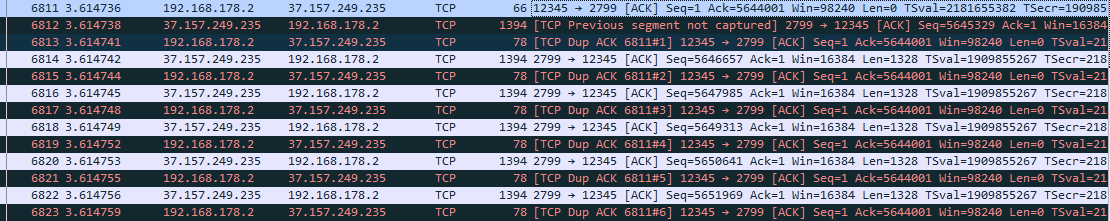
Well, a packet got confused, and decided to get lost. And now, all of a sudden, i knew why bandwidth was so horrendous. Packetloss. Occasional. With implications for the TCP window. And, of course, that packet loss does not mind TCP packets being in a tunnel. Drop is drop.
This leaves a lot of nice opportunities of where things could go amis:
- My “high quality CPE” could be at fault
- My pf config could be funny
- My little VM box behind the Ziggo link (or a switch on the way there) might be an issue
- My routing table toying could lead to issues
- DOCSIS could be DOCSIS
- The switch in my rack could be ‘funny’
- One of the cables to my upstream could be ‘funny’
- Something else could be off
The first things I ruled out were my pf config (which, to be fair, is not soooooo sophisticated), by simply disabling it, and my routing table stuff, simply by setting up a box that would route directly via AS24961 directly. No tables involved. Both did not change the result.
Something else changed
Interestingly, though, when i tested a bit further yesterday, i noticed something else that was odd: Now, both from Hetzner and IN-Berlin, traffic looked a lot closer to what i’d expect. While this adds a lot more oddity to this issue, it also rules out some possible causes:
- This can’t be DOCSIS being funny
- This can’t be my CPE being funny
- This actually can’t be anything around the systems behind the end-user connection in AS33915
Hence, our map now looks somewhat like this (With intermediate steps obviously skipped), as two ASes are certainly different than the other two:
      +-------+               +-------+
Ziggo |AS33915|<-------+------+AS24961| MyLoc
      +-------+        |      +-------+
          ^            |
          |            |      +-------+
          |            +------+AS59645| Me :-)
          |                   +-------+
          |
          |                   +-------+
          +-------------------+AS29670| IN-Berlin
          |                   +-------+
          |
          |                   +-------+
          +-------------------+AS24940| Hetzner
                              +-------+
Routing around
Still, this leaves ‘things’ around my rack as possible issues. So… how to exclude that. Well, technically, i should have multiple routes to the box in AS33915 via my various upstreams. This is where two of my other upstreams come in: AS50629 (LWLcom) and AS34927 (iFog). Playing around with my upstreams, i quickly noticed that, for iFog, things pretty much looked the same as when i was going via AS24961.
Going through AS50629, however, things looked a bit different. My TCP session steadily climbed to 1gbit throughput. The TCP window scaling plot also looked significantly more promising:
This combination of things (not) working has a beautiful side-effect: Both upstreams come in as tagged VLANs via the same cable. Effectively, this rules out the following causes:
- The switch in my rack could be ‘funny’
- One of the cables to my upstream could be ‘funny’
Effectively only leaving me with:
- Something else could be off
Great. Back to start.
Can’t you have issues elsewhere?
Having ruled out all of my stuff as the root cause, i set out to find other places where this might happen. Using the NLNOG Ring Node at MyLoc and with some help from AS34936, i could quickly establish that it really was not just me. Now, hunting for what was different between AS29670, AS24940, and AS50629 and all the others was on. Tool for that, of course, traceroutes, or rather, MTR.
The issue here, though, is that the packet drops do not really seem to be all that frequent, except in an established TCP session. Which makes it really hard to debug. Only when looking at smokeping over 10 days, i see a very modest drop rate around 0.01%, which i do not see towards my node at IN-Berlin. So, let’s play the exclusion game: What looks different (or the same?) between working and non-working traces?
Looking at traceroutes–here via LWLcom and MyLoc as an example–quickly showed that all traffic to AS33915 would go through the Liberty Global B.V. AS (AS6830) before passing through AS9143 (Vodafone/Ziggo) to the Ziggo AS.
nw-test (37.157.249.226) -> <AS33915> 2022-10-08T23:20:59+0000
   Host										Loss%	Snt	Last	 Avg	Best	Wrst	StDev
1. (waiting for reply)
2. lag19.core3-dus1.bb.as24961.net			 0.0%	7	 0.4	 0.3	 0.2	 0.4	0.1
3. lag8.core1-dus-ix.bb.as24961.net			 0.0%	7	 0.6	 0.6	 0.5	 0.7	0.1
4. 76.74.9.169								 0.0%	7	 0.8	 0.9	 0.6	 1.6	0.3
5. ae22.cr2-fra6.ip4.gtt.net				 0.0%	7	 4.8	 4.5	 3.9	 4.9	0.4
6. ip4.gtt.net								 0.0%	7	12.7	 8.8	 4.0	13.0	3.5
7. de-fra02a-rc1-ae-49-0.aorta.net			 0.0%	7	 7.5	 7.6	 7.5	 8.0	0.2
8. nl-ams02a-rc2-lag-11-0.aorta.net			83.3%	7	 7.4	 7.4	 7.4	 7.4	0.0
9. asd-tr0021-cr101-be60-2.core.as33915.net	 0.0%	7	 7.8	 8.0	 7.8	 8.5	0.3
10. gv-rc0052-cr102-et2-2.core.as33915.net	 0.0%	7	 9.6	 9.7	 9.5	10.0	0.2
11. (waiting for reply)
12. HOST.cable.dynamic.v4.ziggo.nl			 0.0%	7	21.3	20.6	16.4	23.1	2.2
And, for comparison, the working one via LWLcom:
gw01.dus01.as59645.net (195.191.197.254) -> <AS33915> 2022-10-08T23:18:43+0000
   Host										Loss%	Snt	Last	 Avg	Best	Wrst	StDev
1. gw02dus01.lwlcom.dus01.as59645.net		 0.0%	8	 0.7	 0.7	0.5		 1.2	0.2
2. lag-108.ear1.Dusseldorf1.Level3.net		33.3%	7	 0.6	 0.7	0.6		 0.8	0.1
3. ae1.3104.edge7.Amsterdam1.level3.net		 0.0%	7	 4.1	 4.4	3.8		 6.8	1.1
4. nl-srk03a-ri1-ae-8-0.aorta.net			 0.0%	7	 7.6	 7.6	7.5		 7.8	0.1
5. asd-tr0021-cr101-be65.core.as9143.net	14.3%	7	 8.6	 8.7	8.6		 8.8	0.1
6. gv-rc0052-cr102-et2-2.core.as33915.net	 0.0%	7	10.5	10.3	10.1	10.5	0.1
7. (waiting for reply)
8. HOST.cable.dynamic.v4.ziggo.nl			 0.0%	7	21.8	21.6	18.3	22.9	1.5
Looking again a bit closer at the traceroutes, we finally find one host that is the same for all traceroutes that show the occassional drops ruining our throughput, that is absent in all other traces: nl-ams02a-rc2
Sometimes it is nl-ams02a-rc2-lag-11-0.aorta.net. (84.116.130.150), sometimes it is nl-ams02a-rc2-lag-12-0.aorta.net (84.116.139.125). However, when packets drop it is always nl-ams02a-rc2, and if they don’t there is no nl-ams02a-rc2.
Also, note that this box seems to be rather busy dropping control plane packets, rocking an 83.3% packet loss over 7 packets (yeahyeah, router not pinger; but let’s call this ‘circumstancial evidence’; Still, over more packets that box usually gets to ~93% loss).
It must be busy with something.
Taking nl-ams02a-rc2 into account, this leaves us with this version of our graph:
  Ziggo                                   iFog
+-------+                               +-------+        +-------+
|AS33915|           +-------------------+AS34936|<---+---+AS59645| Me :-)
+-------+           |                   +-------+    |   +---+---+
    ^               |                                |       |
    |               |                   +-------+    |       |
    |               +-------------------+AS24961|<---+       |
    |               |                   +-------+            |
    |               |                     MyLoc              |
    |               | < nl-ams02a-rc2                        |
    |               v                                        v
+---+---+       +-------+                                +-------+
| AS9143|<------+ AS6830| Liberty Global                 +AS50629| LWLcom
+-------+       +-------+                                +-------+
Vodafone/           ^                                        |
  Ziggo             | < no nl-ams02a-rc2                     |
                    |                                        |
                    +----------------------------------------+
                    |
                    |
                    |                                    +-------+
                    +------------------------------------+AS29670| IN-Berlin
                    |                                    +-------+
                    |
                    |                                    +-------+
                    +------------------------------------+AS24940| Hetzner
                                                         +-------+
Making it ping^Wnot drop again
To test our hypothesis that nl-ams02a-rc2 has something to do with our bandwidth issues, the most straight-forward way is changing the path for one of the currently affected ASes to one no longer passing it. After filling a ticket with a write-up of the issue with MyLoc, they changed the path for their route to AS33915. Lo and behold: The loss is gone, my windows behave properly, and i can finally saturate my link.
  Ziggo                                   iFog
+-------+                               +-------+        +-------+
|AS33915|           +-------------------+AS34936|<---+---+AS59645| Me :-)
+-------+           |                   +-------+    |   +---+---+
    ^               |                                |       |
    |               |                   +-------+    |       |
    |               |             MyLoc +AS24961|<---+       |
    |               |                   +-------+            |
    |               |                       |                |
    |               | < nl-ams02a-rc2       |                |
    |               v                       |                v
+---+---+       +-------+                   |            +-------+
| AS9143|<------+ AS6830| Liberty Global    |            +AS50629| LWLcom
+-------+       +-------+                   |            +-------+
Vodafone/           ^                       |                |
  Ziggo             | < no nl-ams02a-rc2    |                |
                    |                       |                |
                    +-----------------------+                |
                    |                                        |
                    +----------------------------------------+
                    |
                    |
                    |                                    +-------+
                    +------------------------------------+AS29670| IN-Berlin
                    |                                    +-------+
                    |
                    |                                    +-------+
                    +------------------------------------+AS24940| Hetzner
                                                         +-------+
Conclusion and TODO
So, in conclusion: Sometimes it is really worth it to dig into something very strange that is happening to you. And, methodological debugging can be fun (especially the feeling when you FINALLY figure it out.
Also, there is still the oddity left of why seemingly only OpenBSD, andnot Windows/Linux. My personal guess is the specific implementation of TCP congestion control/window resizing in OpenBSD being just a tad more sensitive.
At the same time, this gives me the interesting TODO item of figuring out how to get AS6830 to fix this issue; Even though i can fix this myself for ASes where i can either change routes myself or motivate others to do so… there is a bit more ASes out there than those i can change routes for (which er… is one)… and i kind of like to fetch stuff via TCP. Let’s be honest, if i call the Ziggo customer support, they’ll probably have me reset my router a couple of times. Then again… probably worth trying. :-|